15 Must-Know Chrome DevTools Tips and Tricks
Google Chrome is the most popular web browser used by web developers today. With a quick six week release cycle and a powerful set of ever expanding developer features turned the browser into a must have tool. Most of you are probably familiar with many of its features like live-editing CSS, using the console and the debugger. In this article we're going to share with you 15 cool tips and tricks that will improve your workflow even more.
1. Quick file switching
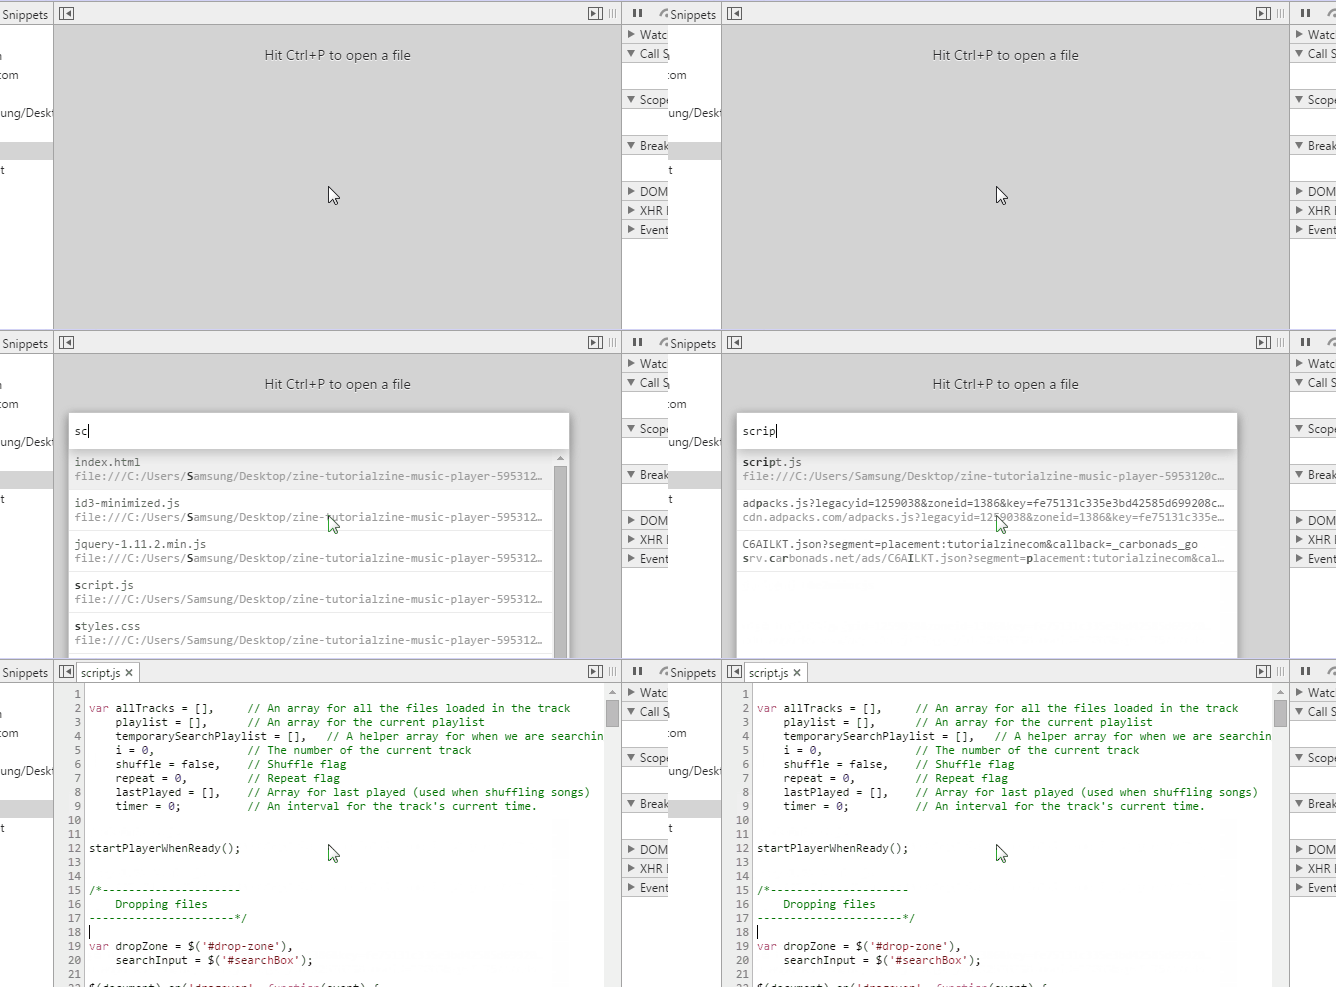
If you've used Sublime Text, you probably can't live without its "Go to anything" overlay. You will be happy to hear that dev tools has it too. Press Ctrl + P (Cmd + P on Mac) when DevTools is opened, to quickly search for, and open any file in your project.
2. Search within source code
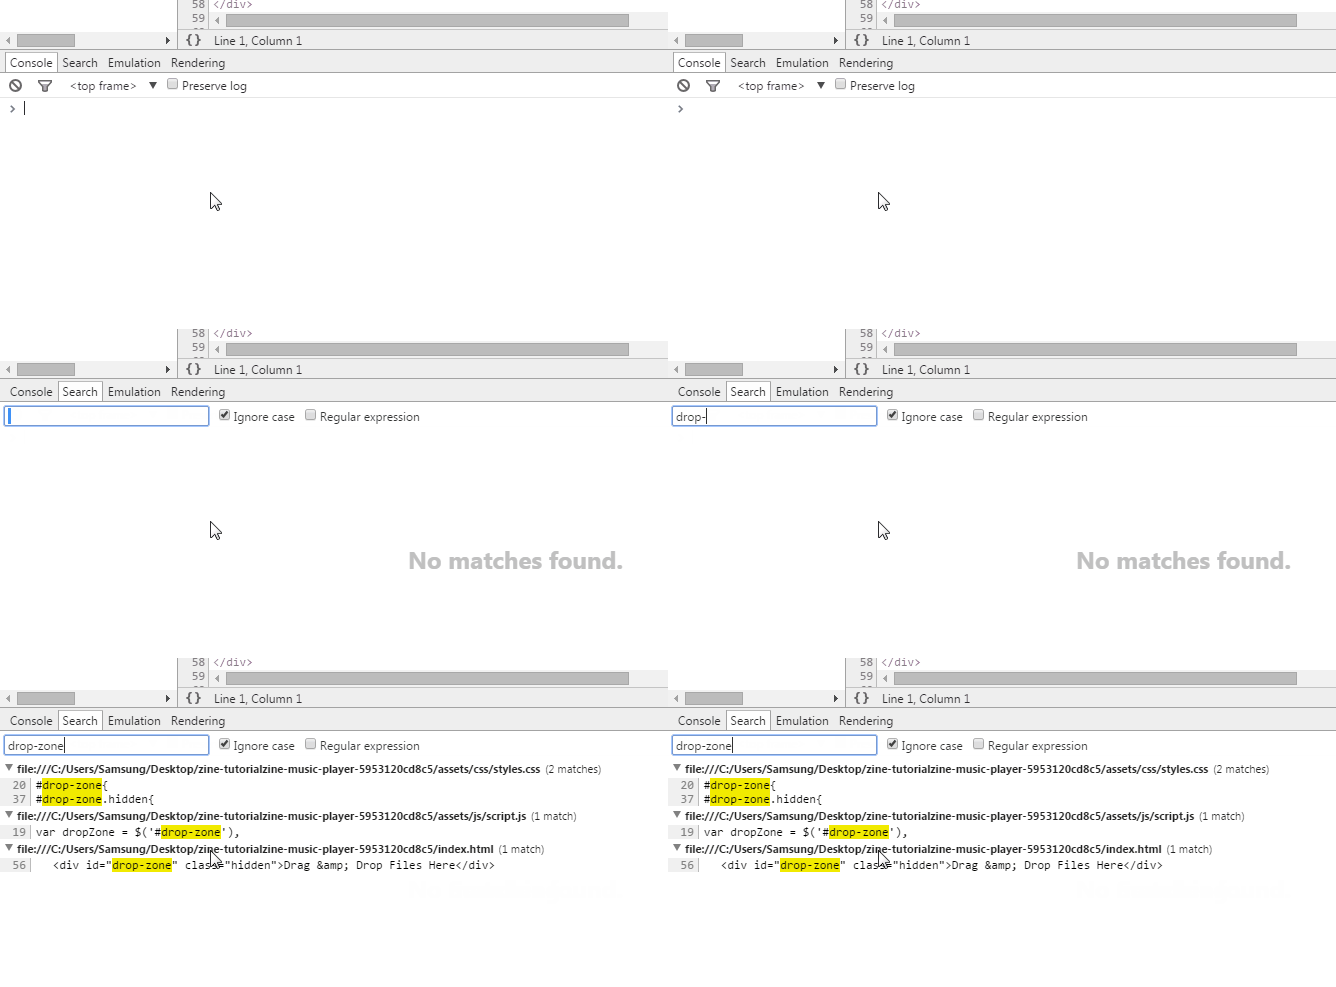
But what about if you wish to search within source code? To search in all files loaded on the page for a specific string, hit Ctrl + Shift + F (Cmd + Opt + F). This method of searching supports Regular expressions as well.
3. Go to line
After you've opened a file in the Sources tab, DevTools allows you to easily jump to any line in it. To do so press Ctrl + G for Windows and Linux, (or Cmd + L for Mac), and type in your line number.
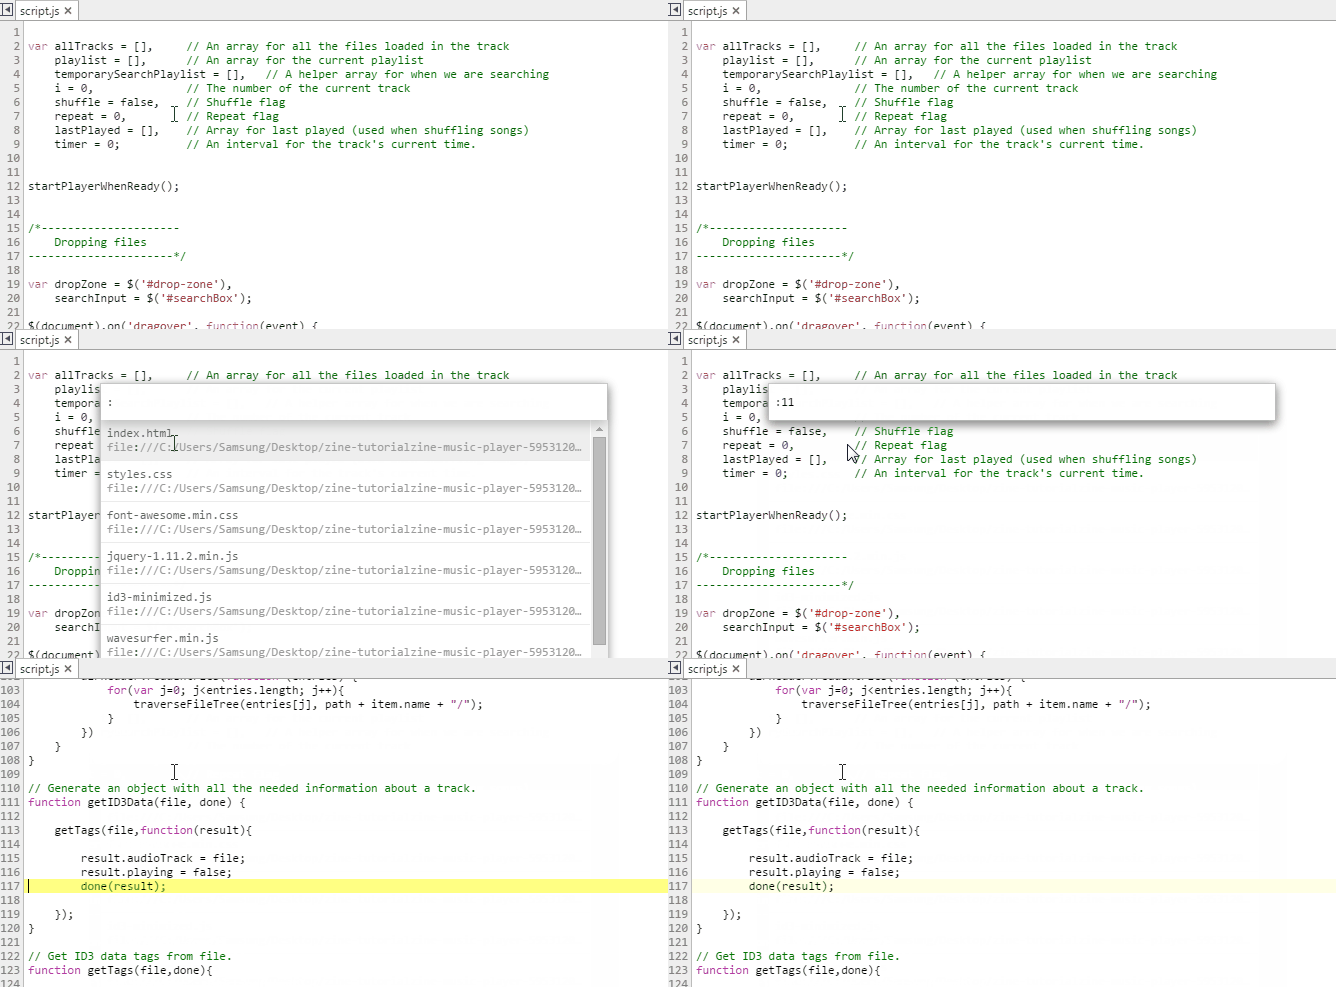
Another way to do this is to press Ctrl + O, and instead of searching for a file, enter ":" followed by a line number.
4. Selecting elements in console
The DevTools console supports some handy magic variables and functions selecting DOM elements:
- $() - Short for document.querySelector(). Returns the first element, matching a CSS selector ( e.g. $('div') will return the first div element in the page).
- $$() - Short for document.querySelectorAll(). Returns an array of elements that match the given CSS selector.
- $0 - $4 - A history of the five most recent DOM elements that you've selected in the elements panel, $0 being the latest.
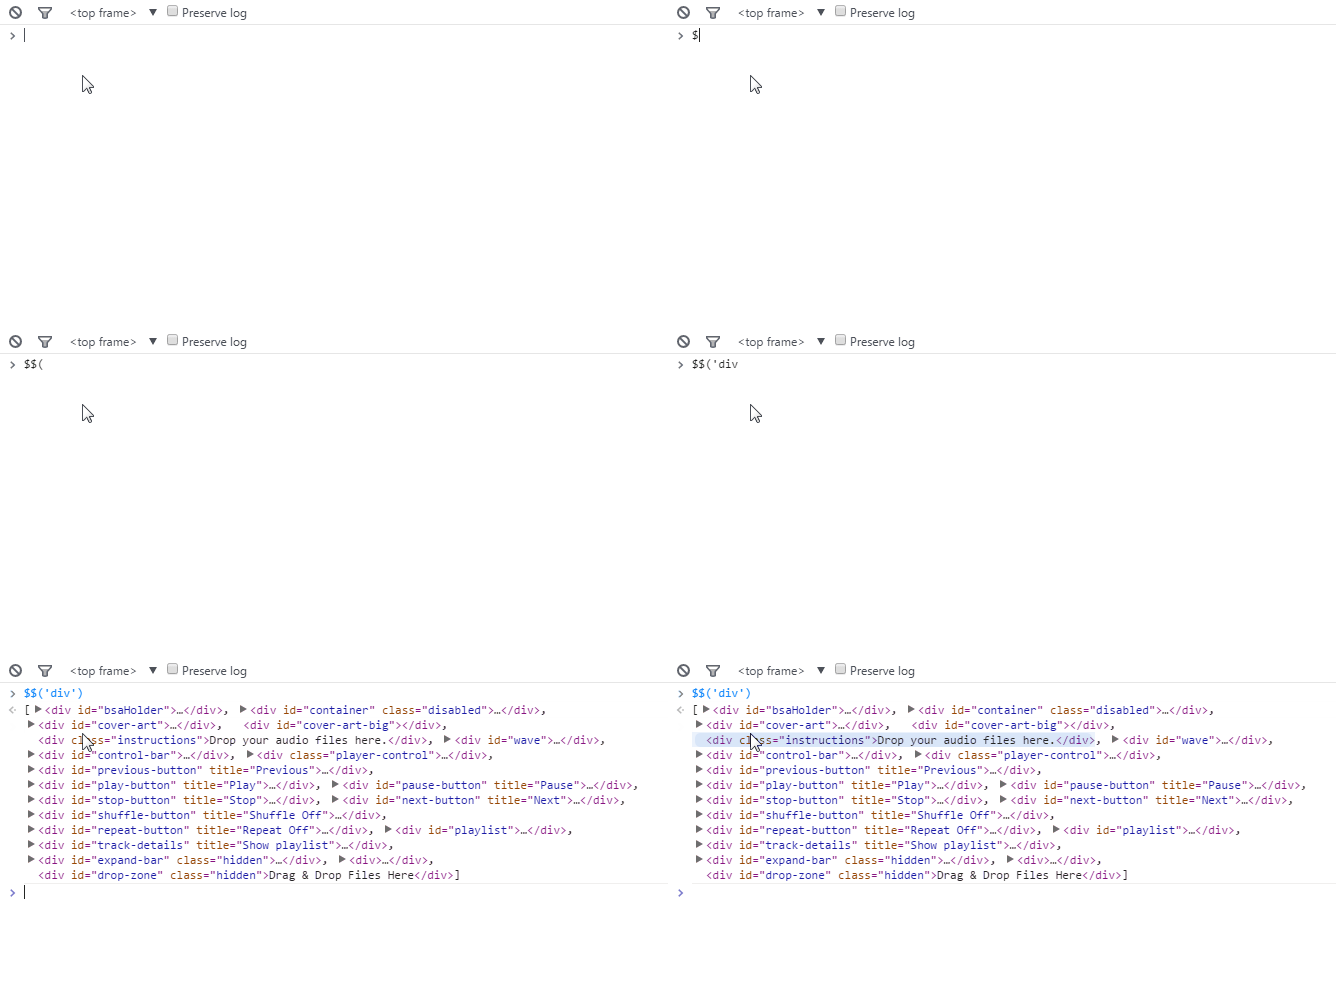
To learn more Console commands read the Command Line API
5. Use multiple carets & selections
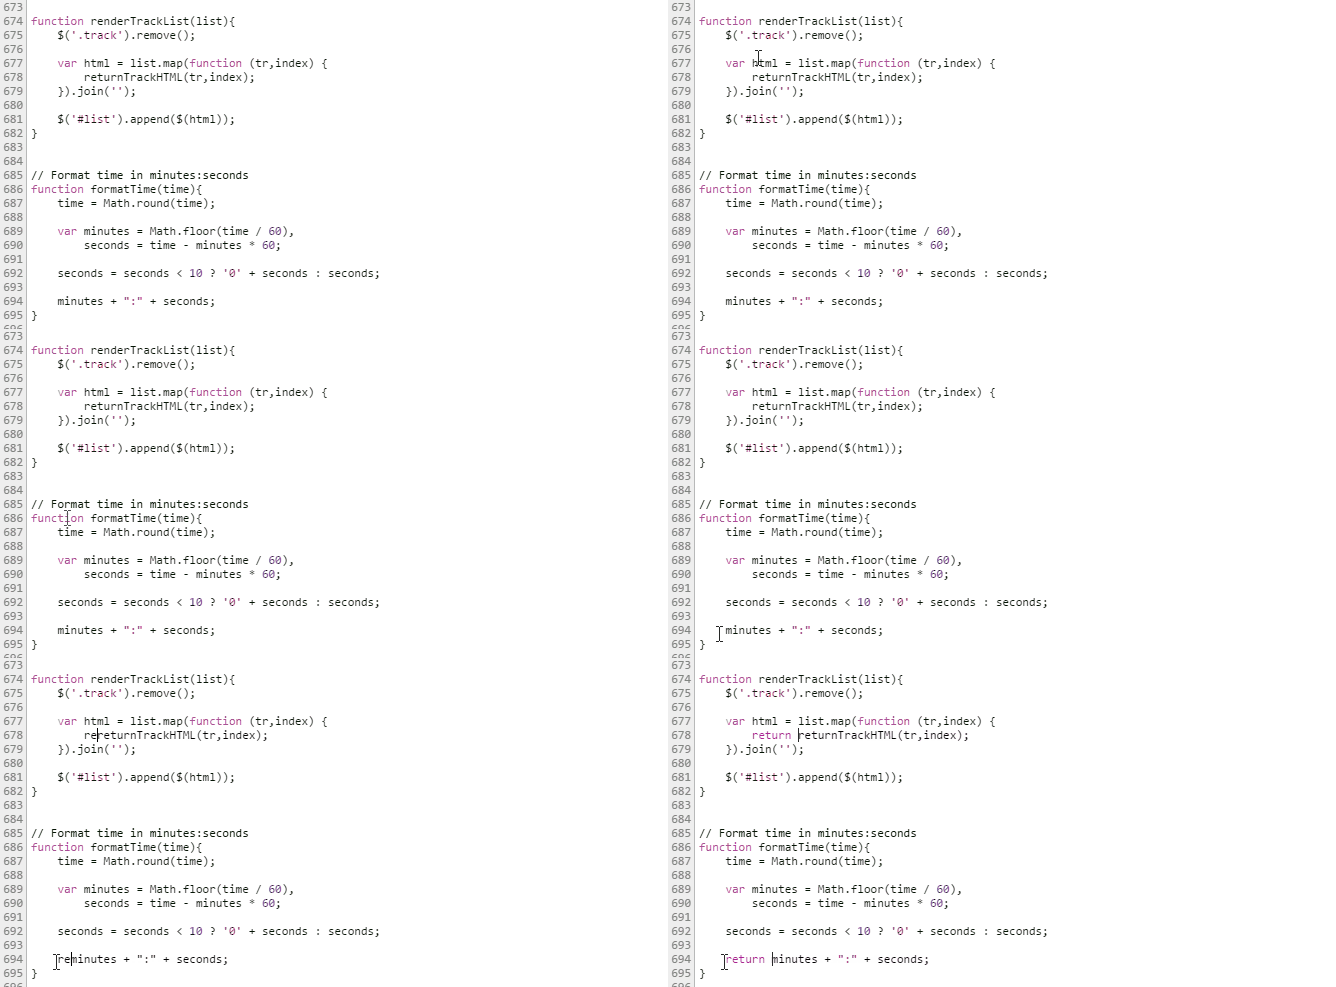
Another killer Sublime Text feature makes its appearance. While editing a file you can set multiple carets by holding Ctrl (Cmd for Mac) and clicking where you want them to be, thus allowing you to write in many places at once.
6. Preserve Log
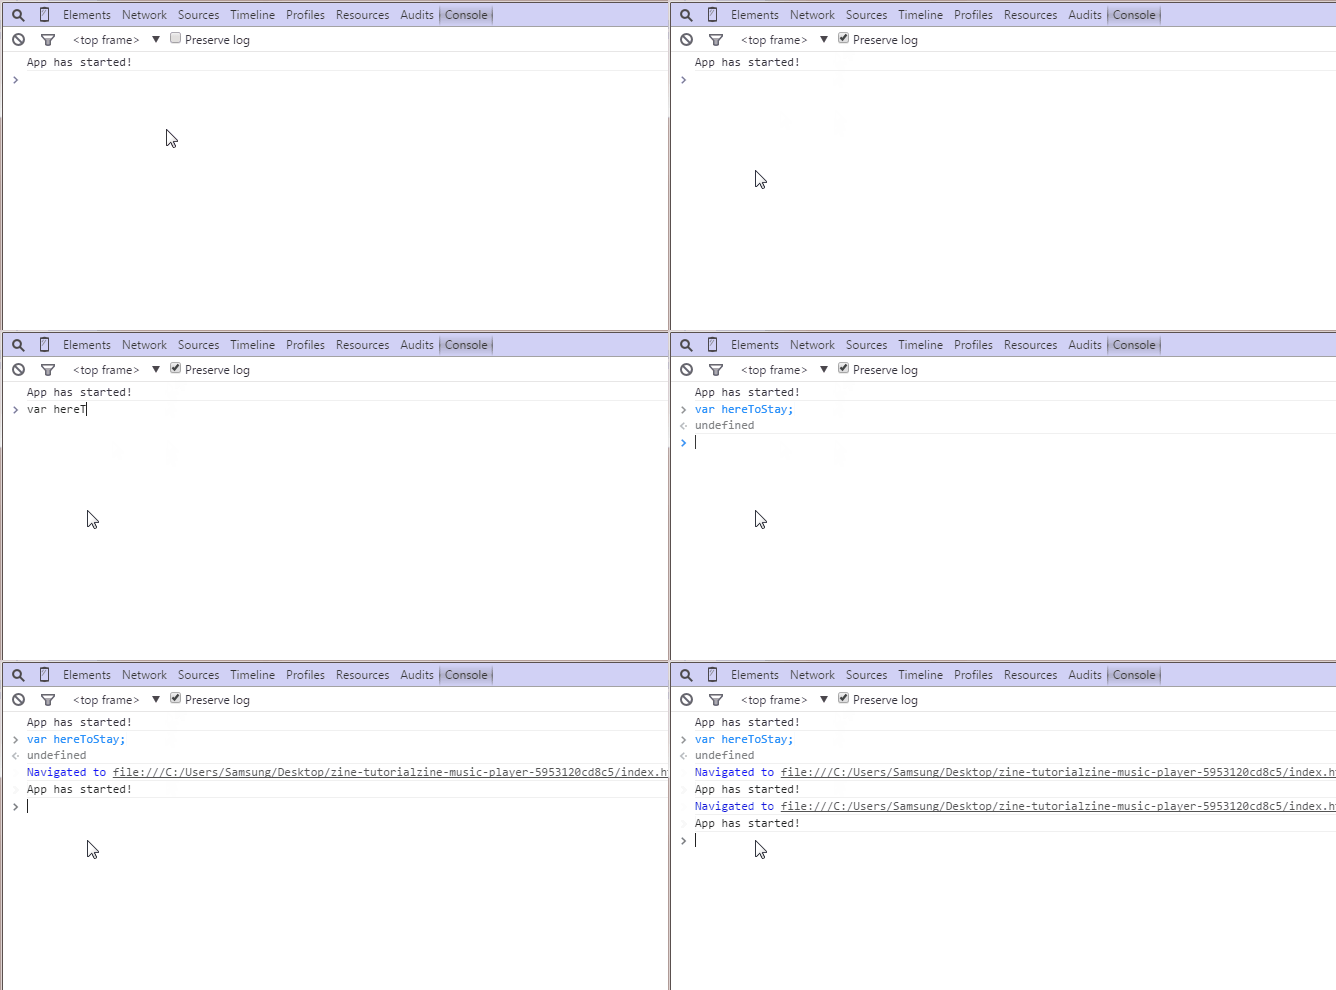
By checking the Preserve Log option in the Console Tab, you can make the DevTools Console persist the log instead of clearing it on every page load. This is handy when you want to investigate bugs that show up just before the page is unloaded.
7. Pretty Print {}
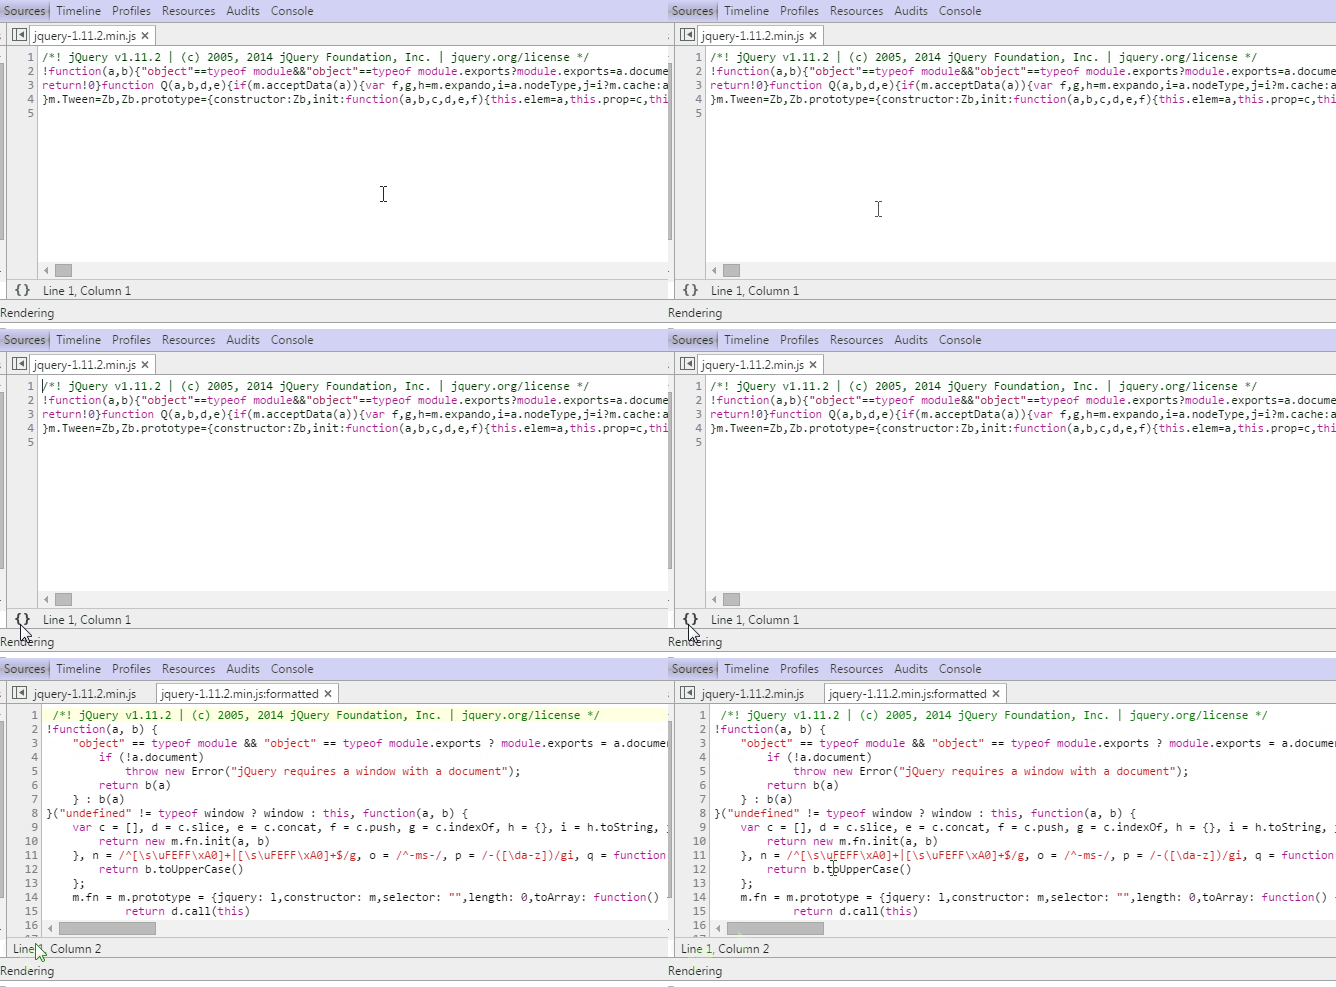
Chrome's Developer Tools has a built-in code beautifier that will help you return minimized code to its humanly readable format. The Pretty Print button is located in the bottom left of your currently opened file in the Sources tab.
8. Device mode
DevTools includes a powerful mode for developing mobile friendly pages. This video from Google goes through most of its main features such as screen resizing, touch emulation and bad network connections simulator.
https://www.youtube.com/watch?v=FrAZWiMWRa4
9. Device emulation sensors
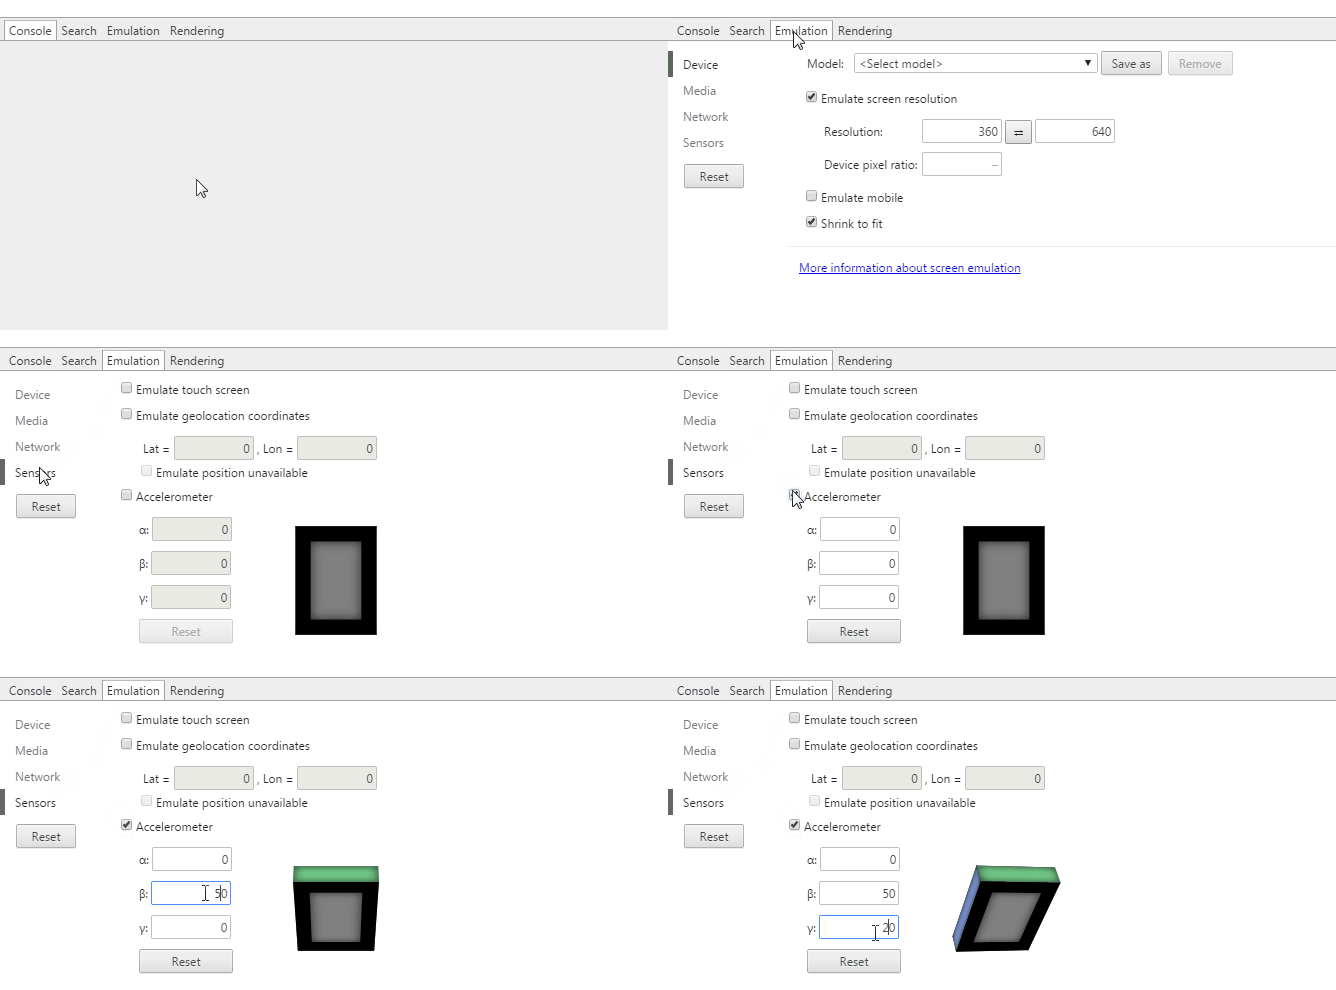
Another cool feature of Device Mode is the option to simulate mobile devices' sensors like touch screens and accelerometers. You can even spoof your geographic location. The feature is located in the bottom part of the Elements tab under Emulation -> Sensors.
10. Color Picker
When selecting a color in the Styles editor you can click on the color preview and a picker will pop up. While the color picker is opened, if you hover over your page, your mouse pointer will transform into a magnifying glass for selecting colors with pixel accuracy.
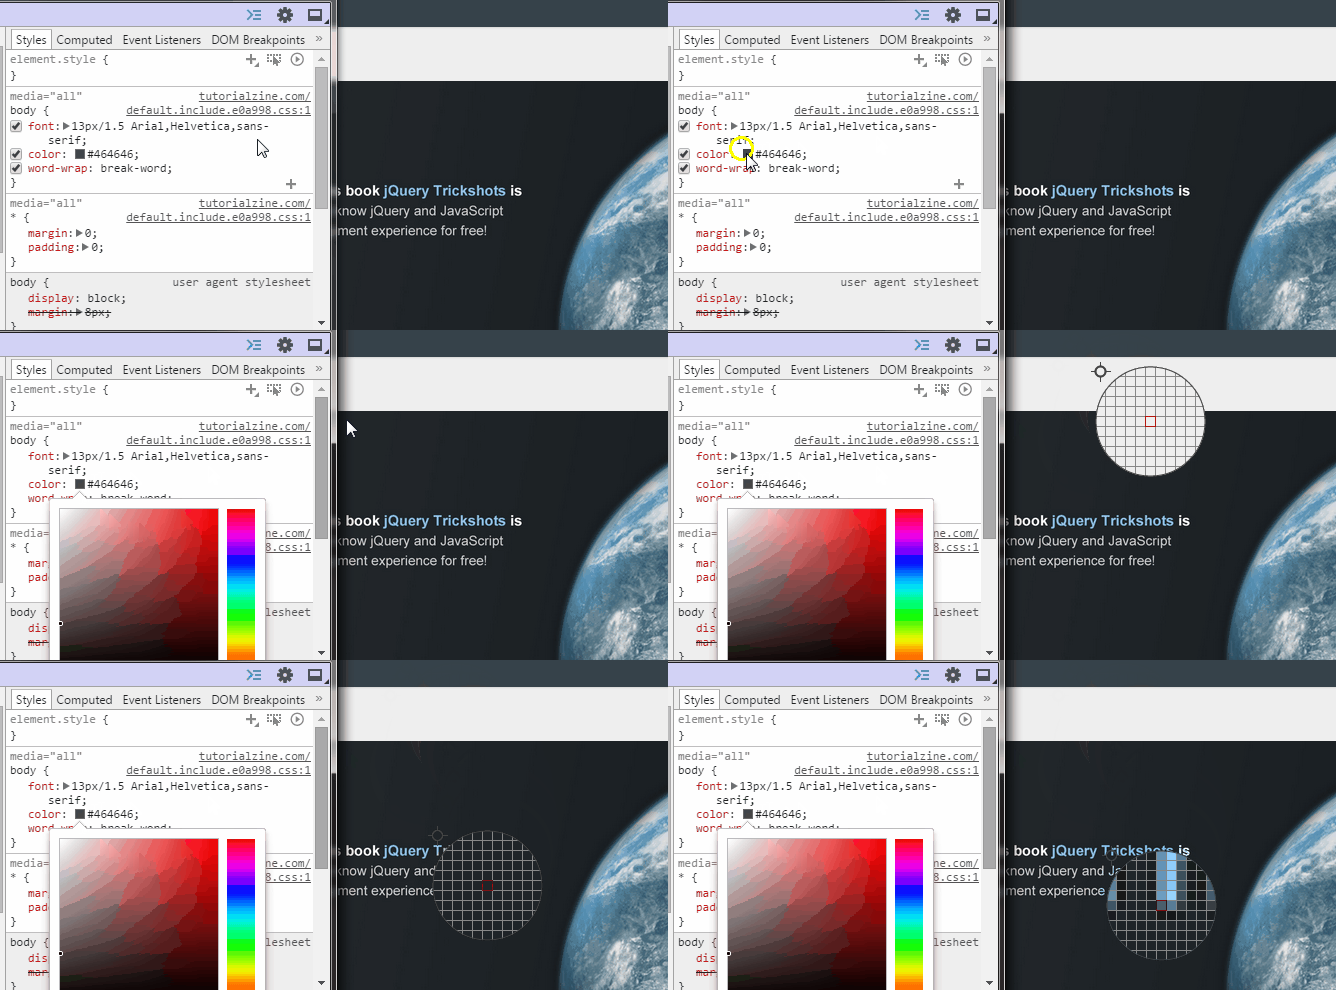
11. Force element state
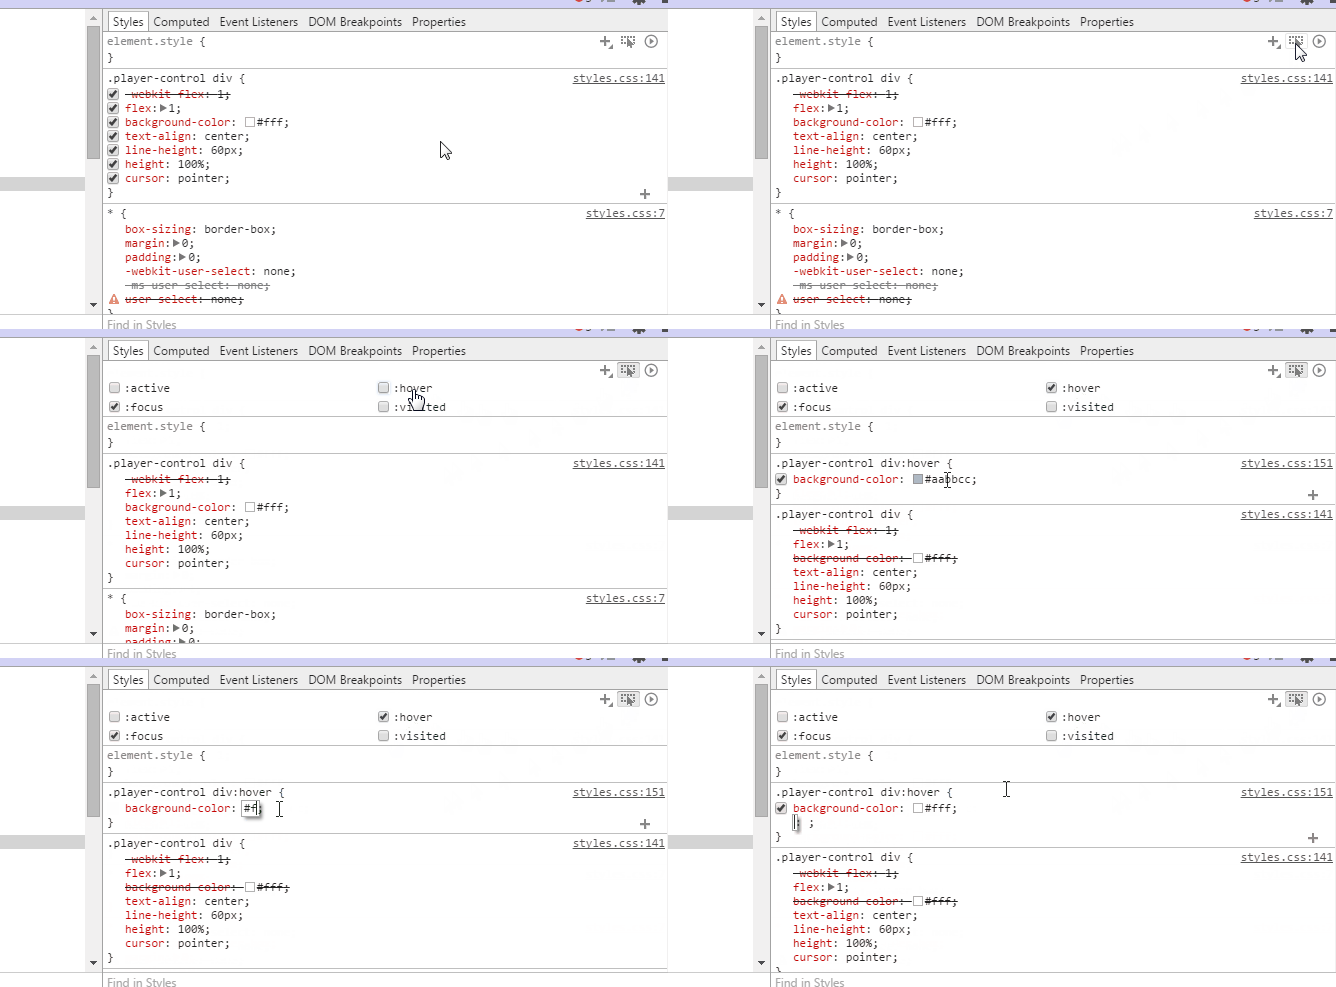
DevTools has a feature that simulates CSS states like :hover and :focus on elements, making it easy to style them. It is available from the CSS editor.
12. Visualize the shadow DOM
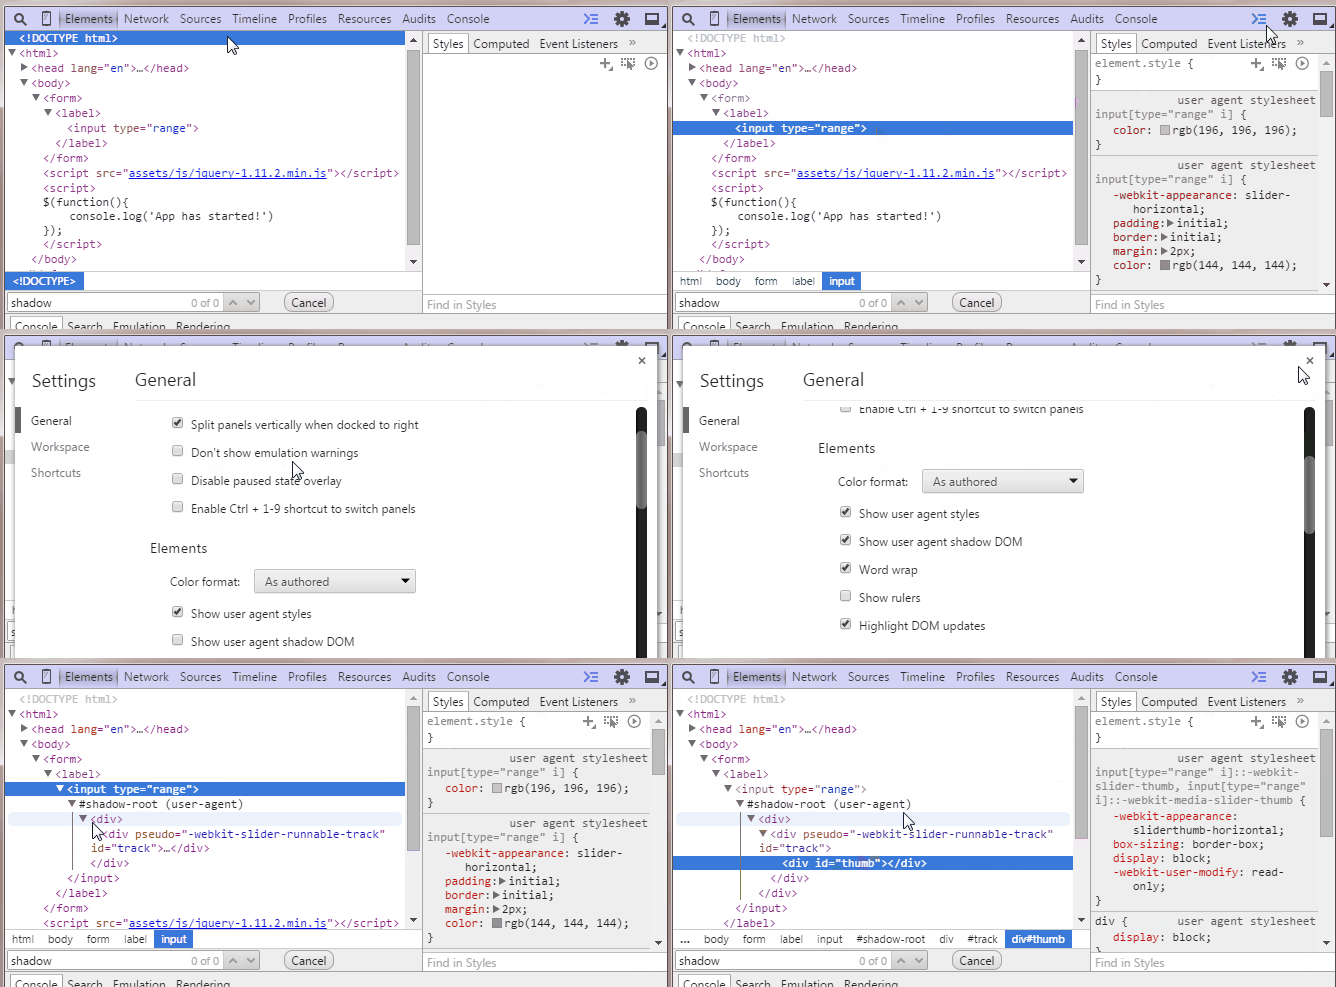
Web browsers construct things like textboxes, buttons and inputs out of other basic elements which are normally hidden from view. However, you can go to Settings -> General and toggle Show user agent shadow DOM, which will display them in the elements tab. You can even style them individually, which gives you a great deal of control.
13. Select next occurrence
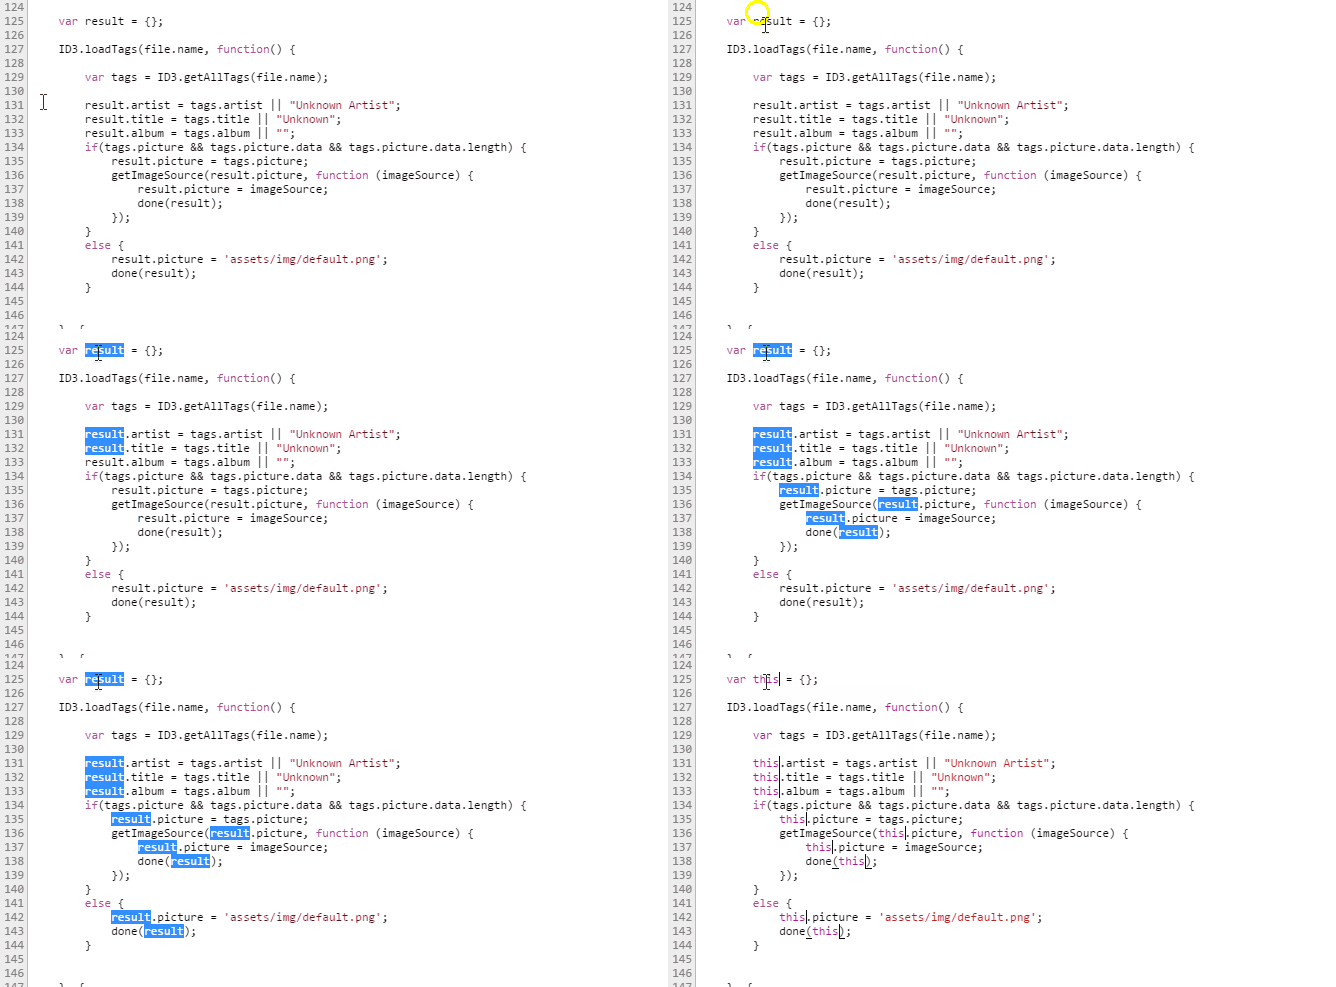
If you press Ctrl + D (Cmd + D) while editing files in the Sources Tab, the next occurrence of the current word will be selected as well, helping you edit them simultaneously.
14. Change color format
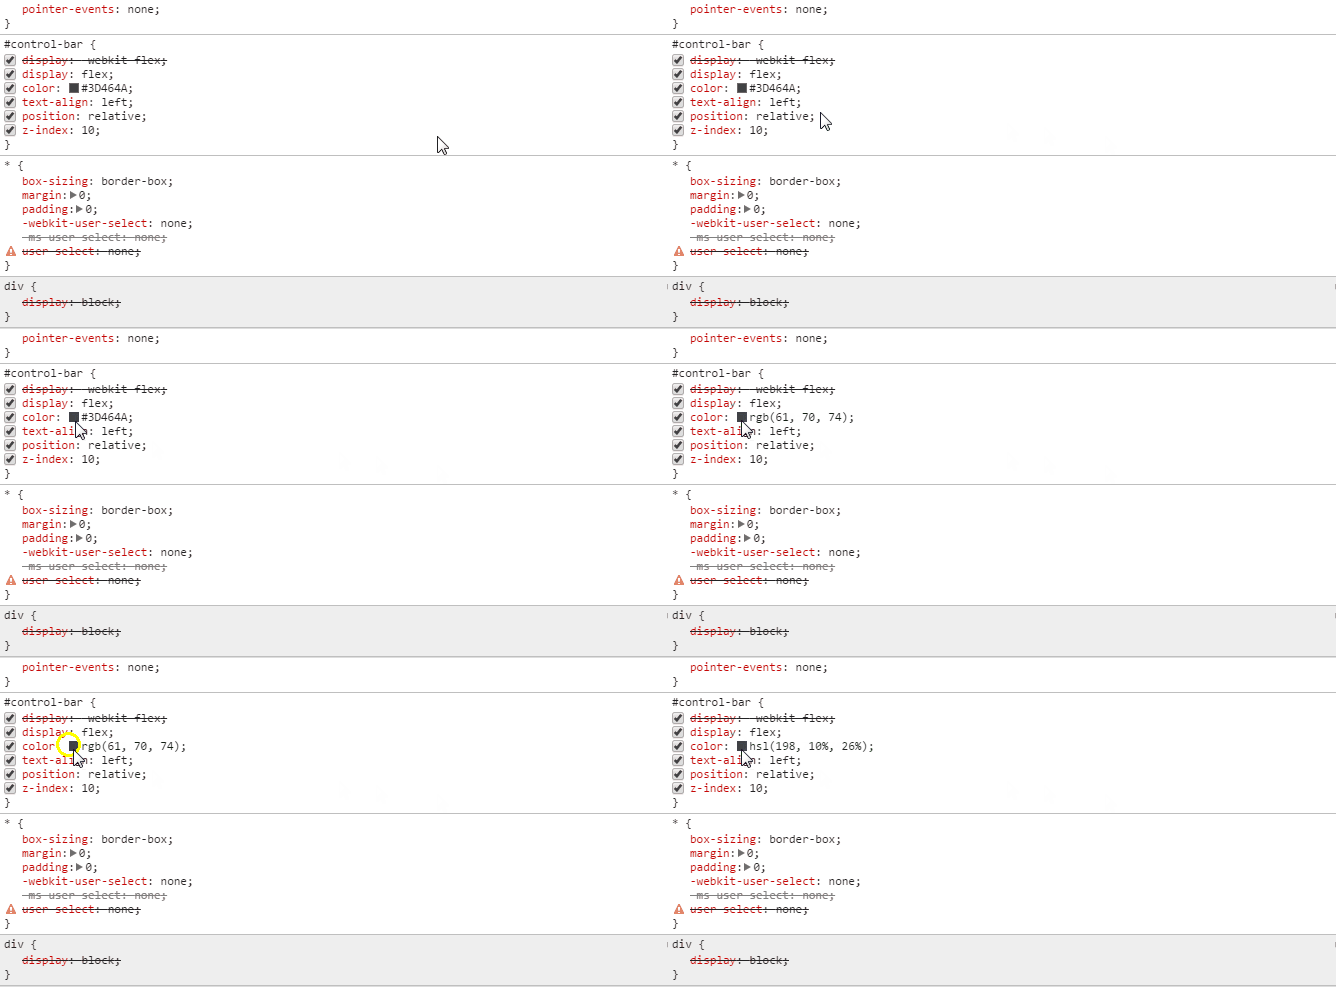
Use Shift + Click on the color preview to alter between rgba, hsl and hexadecimal formatting.
15. Editing local files through workspaces
Workspaces are a powerful Chrome DevTools feature, which turns it into a real IDE. Workspaces match the files in the Sources tab to your local project files, so now you can edit and save directly, without having to copy/paste your changes into an external text editor.
To configure Workspaces, go to the Sources tab and right click anywhere in the left panel (where the sources are) and choose Add Folder To Worskpace, or just drag and drop your whole project folder into Developer Tools. Now, the chosen folder, its sub directories and all the files in them will be available for editing no matter what page you are on. To make it even more useful, you can then map files in your folder to those used by the page, allowing for live editing and easy saving.
You can learn more about Workspaces here.
Further reading
A long list of tips and tricks in the Google Chrome docs
Bootstrap Studio
The revolutionary web design tool for creating responsive websites and apps.
Learn more
I already knew them all... except #5 and #13, that actually blew my mind!
I didn't expect DevTools to be already there in editing stuff.
Will soon be time to drop text editors altogether?
It really looks like we are headed that way. There are already powerful extensions for it, and an awesome dark theme that turn DevTools into a powerful IDE. All we need is support for a few more languages.
Great stuff. I am a long time Firefox user, but maybe will test Chrome DevTools.
Me too. I'm using firefox and want to test this on Chrome
These are amazing. Been using dev tools for so long now, and didn't know half of these. MIND BLOWN!
What program have you used to make this gorgeous GIFs?
Hi Evgeny!
For the making of the GIFs, I used this little tool - ScreenToGif. Its really easy to set it up and use it :)
Hello, great article! We translate your article and published here in Brazil, credits were maintained. See: https://www.turbosite.com.br/blog/15-dicas-para-desenvolver-utilizando-o-chrome-devtools/
Very good!
Congrats!
There is another trick that is quite usefull : using the console as a calculator. It works like a charm.
Thank you so very much, very interesting and useful tricks
this is so useful for me :) thank you
Very useful, bravo!
One more thing, then you are in development mode, press and hold down reload button, and you will see reload options. Which are useful if you want hard reload, or clean the cashes.
Wow...thank you very much for sharing. I didn't know there were so many handy tips in Chrome Dev Tools until I read your article...particularly, tip no.7. I noticed that '{}' icon in the Dev Tools...but never knew the wonders it could do. Now I know :D
7 Prettyprint is a seriously important tip, it should be made more clear/prominent in the GUI to Chrome devs what { } does, its nearly impossible to horizontally scroll through a giant line looking for one specific string.
Do you know if we can manage the folders and open files as projects?